Image Credit: https://medium.com/@khairulomar/deconstructing-time-series-using-fourier-transform-e52dd535a44e
Fourier Analysis: Mathematical Transformations in Financial Markets
Mathematical models often serve as sturdy anchors in a world of constant financial market fluctuations. One such tool, Fourier Analysis, carries profound significance in these choppy waters. This article explores the practicalities, applications, and limitations of Fourier Analysis within financial markets. Brace yourself for an insightful voyage through this transformative mathematical concept.
Understanding Fourier Analysis
Fourier Analysis, named after the brilliant French mathematician Jean-Baptiste Joseph Fourier, holds a fundamental position in fields ranging from physics to finance. At its core, Fourier Analysis involves decomposing complex waves or signals into simpler sine and cosine waves, applying the Fourier Transform formula.
Put plainly, Fourier Analysis unravels a complex signal, allowing analysts to understand the primary constituent parts or frequencies that shape it. Thus, it deciphers the complex into the understandable, paving the way for detailed analysis and sound decision-making.
Applications in Financial Markets
Let's now shift our attention to the crux of the matter: how does Fourier Analysis fit into financial markets, particularly in a market context?
First and foremost, Fourier Analysis serves a critical role in options pricing. It contributes significantly to calculating the value of options contracts. By dissecting price oscillations into simpler waves, it uncovers intricate patterns that can predict future pricing trends. As a result, traders gain an edge by assessing the likelihood of various outcomes, thereby making informed decisions.
Another substantial application lies in derivative structuring. Derivatives, inherently complex financial instruments, require sophisticated tools for accurate pricing and risk assessment. Here, Fourier Analysis proves invaluable, helping structure complex derivatives like options and swaps.
Additionally, Fourier Analysis finds usage in strategic asset allocation. Asset allocation is challenging in a diverse, dynamic market such as India. Fourier Analysis, by identifying underlying frequencies in market data, assists in detecting key market trends. Consequently, it aids in crafting asset allocation strategies that align with market movements and investor risk profiles.
Limitations of Fourier Analysis
While Fourier Analysis carries weight in financial markets, it does come with certain limitations. Understanding these can help investors apply the concept more judiciously.
The fundamental assumption of Fourier Analysis rests on the premise of stationary, periodic data. However, financial markets rarely exhibit such characteristics, especially in a rapidly developing economy like India. This discrepancy can constrain the effectiveness of Fourier Analysis in certain scenarios.
Moreover, implementing Fourier Analysis demands substantial mathematical expertise. Given its roots in abstract mathematics, it poses a formidable challenge for market participants lacking deep mathematical skills.
A Simple Illustration
Consider a simplified example to clarify the application of Fourier Analysis in financial markets.
Assume an equity market displaying oscillating stock prices. Visualize this movement as a complex wave. Applying Fourier Analysis to this wave involves breaking it into simpler sine and cosine waves. This step mirrors using a prism to split white light into its constituent spectrum of colours.
These simpler waves equate to essential frequency components of the stock price oscillations. Recognizing and understanding these components can lead to improved comprehension of market dynamics. For instance, identifying a dominant frequency may point towards a persistent market trend, aiding in strategic decision-making.
Sample Python Code:
Python code snippet demonstrating a Fourier transformation on an oscillating time series, such as stock prices.
We will use the Fast Fourier Transform (FFT) function provided by the numpy library. We will also create synthetic stock price data with a clear oscillating pattern to demonstrate the process. This is a simplified example for the sake of clarity.
This Python script reads a CSV file of stock prices, performs a Fourier Transform on the prices, and identifies the dominant frequencies.
import pandas as p
import numpy as np
import matplotlib.pyplot as plt
# Create synthetic stock price data
t = np.linspace(0, 1, 500, False) # 1 second timeframe
sig = np.sin(3*np.pi*2*t) + 0.5*np.sin(80*2*np.pi*t) # Signal with two frequencies
df = pd.DataFrame({'time':t, 'price':sig})
# Perform the Fourier Transform and compute the spectral density (power spectrum)
fft_vals = np.fft.fft(df['price'])
fft_abs = np.abs(fft_vals)
fft_norm = fft_abs / len(df['price']) # normalization
freq = np.fft.fftfreq(len(df['price']), t[1] - t[0]) # frequencies present in the signal
# Identify the dominant frequency
dominant_freq = freq[np.argmax(fft_norm)]
# Plotting the data
fig, axs = plt.subplots(2)
fig.suptitle('Fourier Analysis on Stock Price Data')
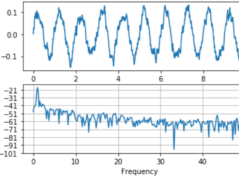
axs[0].plot(df['time'], df['price'])
axs[0].set(xlabel='Time (s)', ylabel='Price')
axs[1].plot(freq, fft_norm)
axs[1].set(xlabel='Frequency (Hz)', ylabel='Normalized amplitude')
plt.show()
print(f"The dominant frequency in the stock price data is: {dominant_freq} Hz")
This code first generates a time series with two sine waves of different frequencies. It then performs a Fourier transform on this data to obtain the frequencies present in the signal. Lastly, it identifies the dominant frequency and plots the original time series and its corresponding frequency spectrum.
Takeaways for Fourier Analysis
Fourier Analysis, an intricate mathematical tool, provides unique insights into financial markets by detecting hidden patterns in data. Its powerful role in options pricing, derivative structuring, and strategic asset allocation cannot be underestimated. While it does pose certain challenges, such as the need for periodic data and deep mathematical expertise, the benefits it confers are significant.
By embracing Fourier Analysis, financial market participants can transform unpredictability into a realm of opportunity. A change in the way we perceive data can dramatically alter our market prowess.
Remember that financial markets, like oceans, remain in constant flux. However, we can navigate these waters with tools like Fourier Analysis with greater confidence and accuracy. As we continue exploring abstract mathematics's role in shaping the future of finance, stay tuned for more insightful, engaging content. Dive deeper into Fourier Analysis and find your way to financial success!
Follow Quantace Research
-------------
Why Should I Do Alpha Investing with Quantace Tiny Titans?
1) Since Apr 2021, Our premier basket product has delivered +57% Absolute Returns vs the Smallcap Benchmark Index return of +14%. So, we added a 43% Alpha.
2) Our Sharpe Ratio is at 1.4.
3) Our Annualised Risk is 20.1% vs Benchmark's 20.4%. So, a Better ROI at less risk.
4) It has generated Alpha in the challenging market phase.
5) It has a good consistency and costs 6000 INR for 6 Months.
-------------
Disclaimer: Investments in securities market are subject to market risks. Read all the related documents carefully before investing. Registration granted by SEBI and certification from NISM in no way guarantee performance of the intermediary or provide any assurance of returns to investors.
-------------
#future #machinelearning #research #investments #markets #investing #like #investment #assurance #management #finance #trading #riskmanagement #success #development #strategy #illustration #assurance #strategy #mathematics #algorithms #machinelearning #ai #algotrading #data #financialmarkets #quantitativeanalysis #money