Decoding Financial Frequencies: A Deep Dive into Spectral Analysis in Indian Markets
Introduction to Spectral Analysis
The financial markets, particularly the bustling and intricate landscape of Indian markets, are in perpetual motion. This constant flux, governed by myriad factors, presents as a blend of overlapping signals. For analysts and traders, discerning coherent patterns from this apparent cacophony is a challenge. Enter Spectral Analysis, an advanced tool that allows us to differentiate and study these overlapping frequencies, providing a clearer picture of market dynamics.
Understanding Spectral Analysis
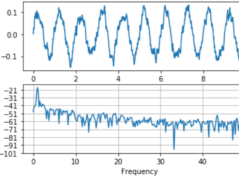
- The Underlying Science: At its foundation, Spectral Analysis concerns itself with decomposing a complex market signal into its constituent frequencies. Think of it as a musical chord being separated into individual notes.
- Waveforms and Market Signals: Every market activity, from trading volumes to price fluctuations, results in signals. Spectral Analysis aids in categorizing these signals into waveforms based on their frequencies. High-frequency waveforms could denote daily trading rhythms, while low-frequency ones might signify long-term trends.
The Relevance for Indian Markets
Indian markets, with their unique blend of local dynamics and global influences, exhibit a rich tapestry of signals.
- Higher Frequency Insights: Daily trading, policy announcements, quarterly financial results, and geopolitical events contribute to high-frequency changes.
- Macro Influences: Economic policies, foreign investment flows, and large-scale socio-economic shifts contribute to longer, low-frequency changes.
By leveraging Spectral Analysis, one can discern the relative impact and significance of these forces, allowing for better strategy formulation.
Integration with Data Science and AI
The merger of financial analytics with Data Science and AI has given rise to sophisticated models.
- An Edge over Traditional Models: Models like GARCH, while powerful, come with inherent assumptions. Spectral Analysis, on the other hand, offers a non-parametric approach. It's a way to filter out the noise, giving data models a clearer signal to analyze.
- Training AI with Frequency Data: Machine learning models trained on frequency-isolated data can yield superior predictions. The 'noise-reduced' data offers a cleaner training set, ensuring that the AI focuses on substantial, impactful patterns.
Challenges and Limitations
- Not a Forecasting Tool: A fundamental limitation is that Spectral Analysis does not predict future market movements. It's a tool to understand current and past dynamics.
- Dependency on Quality Data: The efficacy of Spectral Analysis is heavily reliant on the quality of data fed into it. Erroneous or incomplete data can lead to misleading frequency outputs.
Spectral Analysis in Practice: A Real-World Example
Consider the Indian IT sector. An analyst observes a consistent, low-frequency upward trend over several years but also notes high-frequency fluctuations around quarterly financial announcements.
By applying Spectral Analysis:
- The long-term, low-frequency trend might be attributed to increased global outsourcing and robust industry growth.
- The high-frequency fluctuations could be associated with short-term market reactions to quarterly results, currency fluctuations or policy changes.
Understanding these separate frequencies allows for better investment strategies: a long-term investment approach for those aligned with the sector's growth and a short-term trading approach to leverage quarterly fluctuations.
Conclusion: The Path Ahead for Spectral Analysis in Indian Markets
As we stand on the cusp of technological advancements, tools like Spectral Analysis will inevitably become more integrated into financial analytics, especially in markets as dynamic as India's. However, a balanced approach, combining this tool with others and grounding findings in market realities, will be essential.
For analysts, traders, and financial enthusiasts, the key lies not just in adopting new tools but in understanding their strengths, limitations, and best-use scenarios. As the Indian markets continue to dance to their rhythm, those equipped with Spectral Analysis will undoubtedly have a clearer understanding of the tune.
Follow Quantace Research
-------------
Why Should I Do Alpha Investing with Quantace Tiny Titans?
1) Since Apr 2021, Our premier basket product has delivered +57% Absolute Returns vs the Smallcap Benchmark Index return of +14%. So, we added a 43% Alpha.
2) Our Sharpe Ratio is at 1.4.
3) Our Annualised Risk is 20.1% vs Benchmark's 20.4%. So, a Better ROI at less risk.
4) It has generated Alpha in the challenging market phase.
5) It has a good consistency and costs 6000 INR for 6 Months.
-------------
Disclaimer: Investments in securities market are subject to market risks. Read all the related documents carefully before investing. Registration granted by SEBI and certification from NISM in no way guarantee performance of the intermediary or provide any assurance of returns to investors.
-------------
#future #machinelearning #research #investments #markets #investing #like #investment #assurance #management #finance #trading #riskmanagement #success #development #strategy #illustration #assurance #strategy #mathematics #algorithms #machinelearning #ai #algotrading #data #financialmarkets #quantitativeanalysis #money