Decision Trees: A Powerful Tool for Predictive Modeling in Finance
Decision trees are a popular machine-learning technique increasingly used in quantitative trading and investing. These algorithms, which can be used to analyze historical financial data and identify patterns that inform investment decisions, have become a valuable tool for traders and investors looking to gain an edge in the markets.

Understanding the Basics of Decision Tree Algorithms
Decision tree algorithms are a type of supervised machine-learning technique that can be used for classification and regression tasks. These algorithms recursively partition a dataset into smaller subsets, with each partition corresponding to a decision or a prediction. The final output is a tree-like structure, with each internal node representing a decision and each leaf node representing a prediction.
Decision tree algorithms can be used to analyze historical financial data and identify patterns that can inform investment decisions. For example, a decision tree algorithm can analyze stock market data and predict whether a stock will increase or decrease in value. This can be useful for traders who make buy or sell decisions based on predicted stock price movements.
Analyzing Historical Financial Data with Decision Trees
One of the critical advantages of decision tree algorithms is their ability to handle non-linear relationships between variables. This makes them well-suited for analyzing financial data, which often contains complex patterns that linear models cannot easily capture.
For example, a decision tree algorithm can analyze historical stock prices and identify patterns associated with price increases or decreases. This can be useful for identifying stocks that are likely to perform well in the future and make profitable investments.
Another example of a decision tree application in finance is identifying patterns in financial data that can be used to predict credit risk. For instance, a decision tree algorithm can be used to analyze a borrower's financial history, such as income, credit score, and employment status, to predict the likelihood of loan default.
Advantages and Disadvantages of Decision Trees in Quantitative Trading and Investing
Decision tree algorithms have several advantages that make them well-suited for quantitative trading and investing. For example, decision trees can handle non-linear relationships between variables, which can handle non-linear relationships between variables and missing data well. They also can handle large amounts of data, making them helpful in analyzing big data sets. Additionally, decision trees are easy to interpret and can provide a clear picture of the decision-making process.
However, decision trees also have some disadvantages. One of the main drawbacks is that decision trees can be prone to overfitting if not used with appropriate constraints. Overfitting occurs when a model is too complex and can fit the noise in the data instead of the underlying trend. This can lead to poor performance when the model is applied to new data.
Another disadvantage of decision trees is that they can be sensitive to small changes in the data. This can lead to the model's instability, making it difficult to interpret the results and make predictions.
Improving Predictive Accuracy with Ensemble Methods
One way to overcome the limitations of decision tree algorithms is to use ensemble methods, which combine multiple decision trees to create a more robust model. Two popular ensemble methods are random forests and gradient boosting.
Random forests, for example, create multiple decision trees and combine their predictions by taking a majority vote. This can help to reduce the overfitting problem and improve the model's predictive accuracy.
Gradient boosting, on the other hand, creates multiple decision trees in a sequential manner, where each tree attempts to correct the mistakes of the previous tree. This can lead to a robust model that can capture complex patterns in the data.
Another popular ensemble method is stacking, where a set of model predictions are used as input to another model (meta-model) to make final predictions. This can provide an even more robust prediction.
The Future of Decision Tree Algorithms in Quantitative Trading and Investing
As big data and artificial intelligence technologies evolve, decision tree algorithms will likely play an increasingly important role in quantitative trading and investing.
For example, decision trees can be combined with big data technologies like Hadoop and Spark to analyze large data sets and make predictions in real time. This can be useful for traders and investors who must make quick and accurate decisions based on market conditions.
Another area where decision trees are likely to be applied in the future is artificial intelligence. Decision trees can be combined with other AI techniques, such as deep learning and reinforcement learning, to create powerful predictive models that can make decisions in complex and dynamic environments.
Overall, decision tree algorithms will continue to be a powerful tool for predictive modeling in finance, potentially improving investment decisions and driving better returns for traders and investors.
Python Code: Predict the movement of stock using Decision Trees
An example of a Python code that uses a decision tree algorithm to predict the movement of a stock (increase or decrease) based on historical Open, High, Low, Close (OHLC) data and volume data:
import pandas as p
from sklearn.tree import DecisionTreeClassifier
from sklearn.model_selection import train_test_split
from sklearn.metrics import accuracy_score
# Load the stock data into a pandas dataframe
data = pd.read_csv('stock_data.csv')
# Calculate the percentage change values for OHLC
data['Open'] = (data['Open'] - data['Close'].shift(1)) / data['Close'].shift(1)
data['High'] = (data['High'] - data['Close'].shift(1)) / data['Close'].shift(1)
data['Low'] = (data['Low'] - data['Close'].shift(1)) / data['Close'].shift(1)
data['Close'] = (data['Close'] - data['Close'].shift(1)) / data['Close'].shift(1)
# Define the feature columns (OHLC and volume data)
feature_cols = ['Open', 'High', 'Low', 'Close', 'Volume', 'Delivery Volume']
# Define the target column (stock movement)
target_col = 'Result'
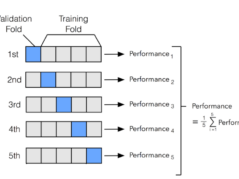
# Split the data into training and testing sets
X_train, X_test, y_train, y_test = train_test_split(data[feature_cols], data[target_col], test_size=0.3, random_state=1)
# Create a decision tree classifier object
clf = DecisionTreeClassifier()
# Train the classifier on the training data
clf.fit(X_train, y_train)
# Make predictions on the test data
y_pred = clf.predict(X_test)
# Calculate the accuracy of the model
accuracy = accuracy_score(y_test, y_pred)
print("Accuracy: ", accuracy)
As you can see, the code first calculates the percentage change for each OHLC value using the shift(1) function. It takes the previous close value as the base and then the new values are used as features for the decision tree algorithm. Keep in mind that this will cause the first rows of the dataset to be removed as they don't have previous close values.
It's important to note that using percentage change values can be useful in some cases, but it also has some limitations. For example, it doesn't provide an idea of the actual value of the stock, and it can be affected by extreme values that can cause the percentage change to be distorted.
Follow Quantace Research
Quantace Chetak Momentum Factor
The Chetak momentum basket aims to track the performance of the top companies within the Nifty 500 selected based on their Normalised Momentum Score. The Normalised Momentum Score for each company is determined based on its 6-month and 12-month price returns, adjusted for volatility. Momentum basket designed by Quantace to Out-Perform the CNX500 Index.
QuantAce Chetak smallcase | Upto 44% returns
Disclaimer: This article is for information only and should not be considered as a recommendation to buy or sell any stocks.