Image Credit : Liow, K. H., Zhou, X., Li, Q., & Huang, Y. (2019). Time–Scale Relationship between Securitized Real Estate and Local Stock Markets: Some Wavelet Evidence. Journal of Risk and Financial Management, 12(1), 16. https://doi.org/10.3390/jrfm1201
Wavelet Analysis: Decoding Financial Market Dynamics with Frequency Domain Tools
Introduction to Wavelet Analysis:
The ability to interpret data accurately and quickly is a game-changer in financial markets. Wavelet analysis, a revolutionary tool in signal processing, presents a fascinating method to decode the complexities of market data. This technique operates in the frequency domain, offering a unique perspective on financial market analysis.
Understanding Wavelet Analysis
Wavelet analysis emanates from the world of signal processing. This technique breaks down a complex signal into simpler "wavelets" or small waves, allowing for more nuanced analysis. In the context of financial markets, these signals translate into time series data, such as stock prices or exchange rates.
An intriguing wavelet analysis aspect lies in its time series data approach. Conventional time series analysis treats data as a whole, while wavelet analysis breaks it down into different frequency components. This allows for a simultaneous study of a signal's time and frequency characteristics, providing a more comprehensive understanding of the underlying system. For instance, decomposing a financial time series with wavelet analysis can help isolate short-term market volatility from long-term trends.
Practical Applications of Wavelet Analysis
In financial markets, wavelet analysis is a potent data interpretation and prediction tool. Its ability to dissect a financial time series into different frequency components proves particularly useful.
High-frequency components often reflect short-term market volatility. This could be due to sudden news events, earnings announcements, or policy changes that cause abrupt shifts in the market. By isolating these high-frequency components, wavelet analysis allows traders and investors to understand better and navigate short-term market fluctuations.
Simultaneously, low-frequency components capture the long-term trends in markets. These trends may reflect underlying economic cycles, industry fundamentals shifts, or investor sentiment changes. Analysts can gain insights into the broader market trajectory by studying these low-frequency components.
Limitations of Wavelet Analysis
Despite its many advantages, wavelet analysis does not offer a one-size-fits-all solution to financial market analysis. As with any tool, it comes with its own set of limitations and challenges.
One of the primary challenges lies in the choice of the wavelet function. The wavelet function can significantly influence the results, and there is no universally optimal one. This means that analysts must exercise caution and make informed decisions when choosing the wavelet function for their analysis.
Additionally, wavelet analysis may perform less well under all market conditions. In highly volatile or turbulent markets, the high-frequency components may become dominant, making isolating and interpreting the low-frequency trends challenging.
A Simple Example of Wavelet Analysis in Financial Markets
To better understand wavelet analysis, consider the daily stock price of a company. These prices fluctuate due to many factors, creating a complex time series data set.
Wavelet analysis helps break down this complexity. It separates the high-frequency changes caused by daily trading activity from the low-frequency trends that reflect the company's overall performance.
This allows for a more nuanced understanding of the stock's behaviour. The high-frequency component might signal a temporary surge in trading volume, while the low-frequency trend may indicate a steady growth or decline over time.
For instance, an increase in high-frequency components could suggest heightened market activity around an earnings announcement or a product launch. Simultaneously, a steady low-frequency trend could indicate the company's consistent performance over the past quarters.
Python code for wavelet analysis
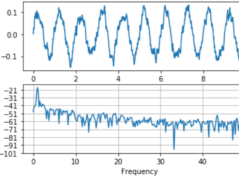
First, we'll generate a synthetic time series dataset:
import numpy as n
import matplotlib.pyplot as plt
from scipy import signal
from pywt import wavedec


# generate synthetic time series data
np.random.seed(0)
time = np.linspace(0, 1, num=500)
price = np.sin(13 * time) + 0.25 * np.sin(50 * time) + np.random.normal(size=500)


plt.figure(figsize=(10, 6))
plt.title("Synthetic 'Stock Price' Time Series Data")
plt.plot(time, price)
plt.show()
Then, we'll use the wavedec function from the pywt library (PyWavelets) to perform a wavelet transform on the data. This function breaks down the time series into different frequency components:
# Perform wavelet decompositio
wavelet_coeffs = wavedec(price, 'db1', level=4)

# Plot the different frequency components
plt.figure(figsize=(10, 8))
for i, coeff in enumerate(wavelet_coeffs):
    plt.subplot(len(wavelet_coeffs), 1, i+1)
    plt.plot(coeff)
    plt.title(f"Frequency component {i}")
plt.tight_layout()
plt.show()
In this example, 'db1' stands for the Daubechies wavelet of order 1, and 'level=4' indicates the level of decomposition. The resulting plot displays different frequency components of the data. The topmost subplot shows the lowest frequency component (i.e., the long-term trend in the stock price), and each subsequent subplot shows increasingly higher frequency components (i.e., short-term fluctuations in the stock price).
Takeaways on wavelet analysis
Wavelet analysis stands as a transformative tool in financial market analysis. Its ability to separate and study different frequency components in time series data offers unparalleled insights into market dynamics.
However, like all tools, it requires careful and informed use. The choice of wavelet function and the interpretation of results demand a deep understanding of both wavelet analysis and the market context.
Follow Quantace Research
-------------
Why Should I Do Alpha Investing with Quantace Tiny Titans?
1) Since Apr 2021, Our premier basket product has delivered +50.4% Absolute Returns vs the Smallcap Benchmark Index return of +11.2%. So, we added a 39% Alpha.
2) Our Sharpe Ratio is at 1.4.
3) Our Annualised Risk is 20.1% vs Benchmark's 20.4%. So, a Better ROI at less risk.
4) It has generated Alpha in the challenging market phase.
5) It has a good consistency and costs 6000 INR for 6 Months.
-------------
Disclaimer: Investments in securities market are subject to market risks. Read all the related documents carefully before investing. Registration granted by SEBI and certification from NISM in no way guarantee performance of the intermediary or provide any assurance of returns to investors.
-------------
#future #machinelearning #research #investments #markets #investing #like #investment #assurance #management #finance #trading #riskmanagement #success #development #strategy #illustration #assurance #strategy #mathematics #algorithms #machinelearning #ai #algotrading #data #financialmarkets #quantitativeanalysis #money